The latest ABS marriage and divorce data for Australia — total marriages, median age, same-gender unions, divorce rates and how long marriages last.
Australia’s marriage landscape continues to shift, driven by changing social values, later partnerships, rising cohabitation, and evolving preferences for how couples formalise their relationships. Here are the latest marriage statistics in Australia for 2026, drawn from the Australian Bureau of Statistics’ Marriages and Divorces, Australia, 2024 release (published 23 July 2025) and other industry sources. See also our companion 2026 wedding statistics for cost and trend data.
Top Australian Marriage Statistics for 2026
Total marriages registered: 120,844 marriages were registered in Australia in 2024 — up 2.0% from 118,439 in 2023 [1].
Crude marriage rate: 5.5 marriages per 1,000 people aged 16 and over, unchanged from 2023 [1].
Median age at marriage: 32.8 for men (down slightly from 32.9 in 2023) and 31.2 for women (unchanged), continuing a decades-long trend of later marriages [1].
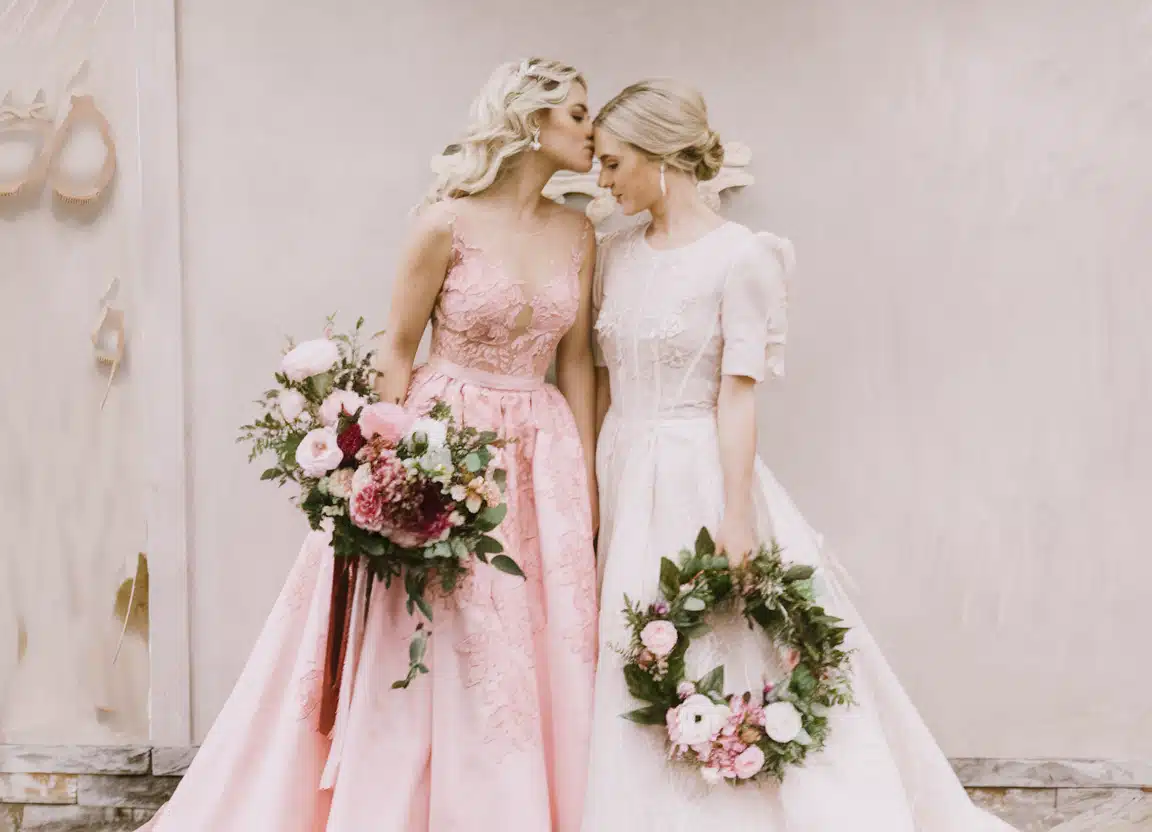
Same-gender marriages: 4,746 in 2024 — up 4.1% from 4,558 in 2023, now accounting for 3.7% of all marriages [1].
Saturday weddings: close to 55,000 of the 120,844 marriages in 2024 took place on a Saturday [1].
Most popular date: 24 February 2024, with 1,773 weddings on a single day [1].
Average Marriage Age & Other Trends
Australians are getting married later in life. In 2024 the median age at marriage was 32.8 for men and 31.2 for women [1] — the median age has risen by more than two years over the last two decades.
From a population perspective, 46.5% of Australians aged 15 and older are currently married, according to the most recent Census [2]. More than 81% of couples now live together before marriage, a steady rise from 71% in 2000 and just 23% back in 1979 [3].
Daily marriage activity remains steady, with an average of about 331 ceremonies per day across Australia. New South Wales and Victoria continue to host the highest volumes of weddings annually [1].
Most weddings — over 83% — are now officiated by civil celebrants rather than religious institutions [4]. 74% of marriages were the first for both partners, underscoring the enduring appeal of traditional unions [4].
Average Length of Marriage
Marriage in Australia remains a relatively long-term commitment. The median duration from marriage to divorce reached 13.2 years in 2024 — up from 13.0 the year before [1]. On average, couples separate after about 8 to 9 years of marriage and officially divorce after 13 years.
12% of divorces had a marriage duration of less than 5 years, and 29% had a marriage duration of 20 years or more [1].
The legal age to marry in Australia is 18, although 16- and 17-year-olds may do so with court and parental approval.
Divorce Rates in Australia
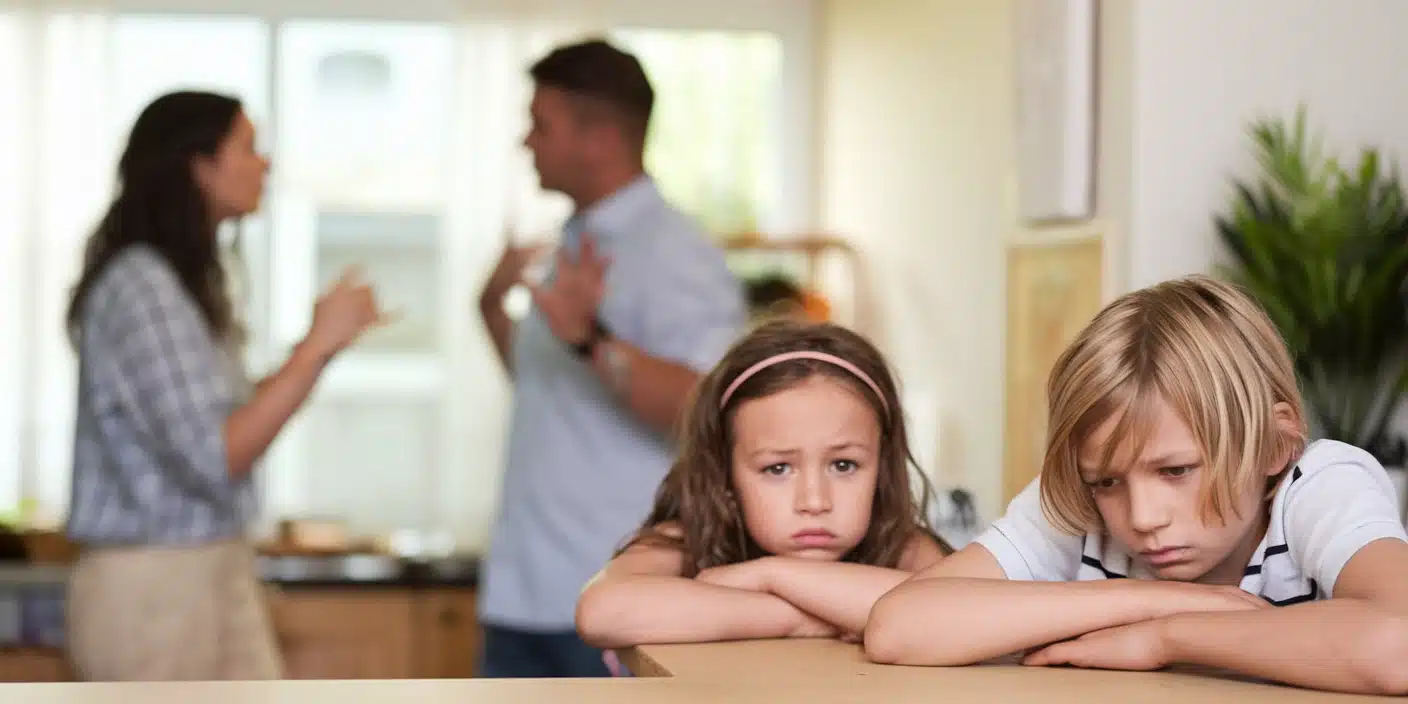
Divorce trends have continued to decline. The crude divorce rate fell to 2.1 per 1,000 people in 2024 — down from 2.3 in 2023 and the lowest level recorded since the 1970s [1].
The median age at divorce is approximately 47.1 for men and 44.1 for women [1]. Over 50% of divorces are now filed jointly, reflecting greater mutual agreement in separations.
When examining divorce by age group, women are most likely to divorce between ages 35–39, while men peak in the 45–49 range [1]. Australians are marrying later, but they’re also staying married longer.
Additional Insights and Cultural Shifts
Same-gender marriages keep rising: 4,746 in 2024, up 4.1% on 2023, now 3.7% of all marriages [1].
Cohabitation is the norm: more than 81% of couples now live together before marriage — up from 71% in 2000 and just 23% in 1979 [3].
Civil ceremonies dominate: more than 83% of weddings are performed by civil celebrants rather than religious ministers [4].
Saturdays still rule: about 55,000 of the 120,844 marriages in 2024 took place on a Saturday, and the single most popular date was 24 February 2024 (1,773 weddings) [1].
Marriages are lasting longer: median duration to divorce climbed to 13.2 years in 2024 — up from 13.0 in 2023 and 12.2 in 2019 [1].
Conclusion
Marriage in Australia remains a strong social institution, even as the way couples approach it continues to evolve. Australians are marrying later, living together first more often, choosing civil ceremonies over religious ones, and — once married — staying married longer. Divorce rates are now at their lowest since the 1970s, while same-gender unions continue to grow steadily.
These figures point to a society that still values marriage but approaches it with more deliberation, equality, and flexibility than in previous generations.
Sources
Browse Wedding Venues?
Tell us about your day and we'll point you to the right vendors and venues for your celebration.